How to best assess pain-related behaviors in preclinical studies
Most humans can tell you they’re in pain. However, assessing pain sensitivity in rodents during preclinical studies is a challenge.
Posted by
Published on
Fri 26 Apr. 2019
Topics
| CatWalk XT | Gait Analysis | Rats |
Most humans can tell you they’re in pain. However, assessing pain sensitivity in rodents during preclinical studies is a challenge. Gait analysis is a great method to address this issue, but which system works best?
Chronic pain is one of the leading causes of global disability. Lower back pain, neck pain, and migraines are an especially large burden to a large part of society. Studies into analgesics and therapies rely on good models and accurate assessment.
Researchers from Peking University and the Capital Medical University (Beijing, China) have been looking into the investigation of pain. Measuring pain sensitivity and pain-related behaviors can be a challenge, both in the clinic as well as in preclinical studies.
Traditional pain parameters
Common methods used for the assessment of pain sensitivity and pain-related behaviors in rodents include punctate allodynia (Von Frey assay) and dynamic (brush) allodynia.
With dynamic allodynia, the rodent’s paw is lightly stroked with a paintbrush. Healthy animals usually don’t respond, while injured animals more likely to respond with rapid and sustained lifting of the paw.
In case of punctate allodynia, the rodent’s paw is probed with a Von Frey fiber, and the paw-withdrawal threshold is measured. For each consecutive probe, a thicker (i.e. stiffer) fiber is used, increasing the effect of the stimulus. After nerve-injury or inflammation, the subject is expected to be more sensitive to this stimulus.
Pain severity versus gait parameters
While well validated, these measurements offer a limited insight into the pain behavior of the animal. In their research, Xu and colleagues found that gait analysis can be better than traditional evaluations, and decided to compare pain sensitivity (they selected the results from the Von Frey assay for this) to gait analysis results.
Pain models and medication
The researchers selected two rodent pain models for their study. The SNI (spared nerve injury) rats served as a model for chronic neuropathic pain, and the CFA (intraplantar complete Freund’s adjuvant) rats were used as a model for inflammatory pain. Test were performed before and after treatment with medication (pregabalin and tramadol, respectively).
Comparing gait analysis methods
In gait analysis, a distinction can be made between methods that are based on the voluntary movement of animals, like CatWalk XT, and systems that are based on forced movement on a treadmill, like DigiGait (also see this blog post about the issue of speed in gait analysis).

Using both apparatuses, coordination data (swing duration and duty cycle) and print area were measured. In addition, print intensity was measured only with CatWalk XT, as DigiGait does not offer this readout. Comparing these to the results of the Von Frey testing, researchers were hoping to see if these gait parameters would correlate with pain sensitivity, and to changes due to medication.
Pain sensitivity reflected in gait parameters
At first sight, coordination data from both systems did correlate with results from Von Frey punctate allodynia testing. Print area and print intensity did not correlate.
Print area calculations
The print area was calculated differently by both systems. Where DigiGait uses direct recordings from the ventral direction to calculate the “projected area” (not merely the actual paw-floor contact), CatWalk XT uses the pressured area to define the print area. In addition, CatWalk XT offers the mean intensity of the contact area during a step cycle as a parameter. To remove possible bias in this data (e.g. due to weight), the authors compared the injured to the uninjured paw.
A closer look into the data
With no correlation found between print area/intensity and the pain sensitivity of the animals, researchers decided to look at data from both hind paws separately. In doing so, CatWalk XT data did reveal an augmentation of print area due to the administration of medication.
Comparing systems
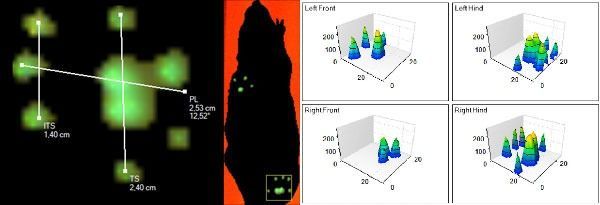
While in principle both systems offered coordination data that is able to reflect the pain sensitivity in rats, CatWalk XT surpassed the treadmill system used in this study, especially in the CFA inflammation model. This is due to the additional intensity data, but also because the Illuminated Footprints™ technique allows for insightful 2D and 3D imaging of the footfalls. For example, the 2D imaging demonstrated the longer duration of the footprint, in turn building up more pressure over time. This behavior is neither visualized nor possible (because of the fixed speed the animals have to walk at) in a treadmill system.
References
Xu, Y.; Tian, N.X.; Bai, Q.-Y.; Chen, Q.; Sun, X.-H.; Wang, Y. (2019). Gait assessment of pain and analgesics: comparison of the DigiGait™ and CatWalk™ gait imaging systems. Neuroscience Bulletin, doi: 10.1007/s12264-018-00331-y
For more information on CatWalk XT gait analysis, visit www.noldus.com/catwalk, or learn more about gait analysis.
Related Posts
CatWalk XT gait analysis vs treadmills
What a print can tell
