EthoVision XT and the Morris Water Maze: expert tips and tricks
Neuroscientist Colleen McSweeney, Ph.D. shares her expert knowledge on using EthoVision XT and the Morris Water Maze. From a brief history to valuable tips and tricks, here is all you need to know on automated tracking.
Posted by
Published on
Wed 11 Aug. 2021
The Morris Water Maze, developed in 1981 by Richard Morris [1], is a tried and true method for assessing spatial learning and memory in rodents.
What is the Morris Water Maze?
The task involves a large circular pool filled with opaque water (typically colored with milk or nontoxic paint). A platform is than placed somewhere in the maze, below the level of the water so the rodent cannot see it.
There are a variety of protocols for how to run this test, but typically the protocol involves placing the rodent in the water from varying entry points, then measuring the amount of time it takes to reach the platform. If the animals do not reach the platform in 60 seconds, they are guided towards the platform and removed. After a certain number of these training trials, a probe trial is completed. In the probe trial, the platform is removed, and the amount of time the rodent spends swimming near the platform is quantified.
Tracking and visualization: from 1981 to 2021
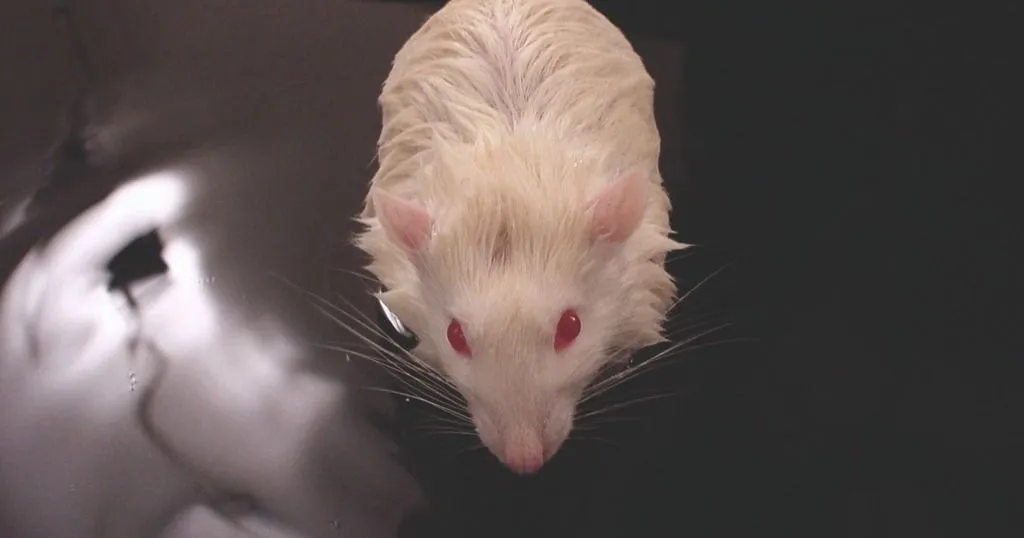
When Richard Morris first started tracking the rodents in the maze, it required a complex system of an image-analyzer and a microcomputer to monitor degrees of contrast - the black head of a hooded rat against the white milk colored water.
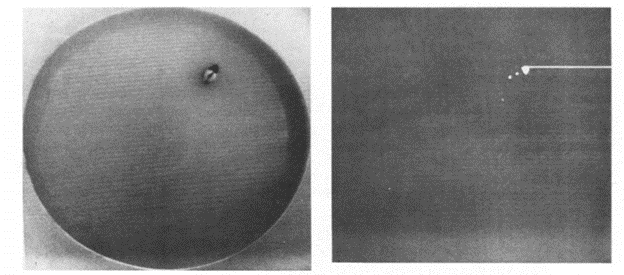
Since 1981, technology has however significantly improved, and you can now use Noldus’ EthoVision XT to automatically quantify this task. EthoVision XT still uses contrast, like the original method, but includes many new features such as deep learning, three body point detection, and various modes of visualizations.
EthoVision XT and the Morris Water Maze: expert tips and tricks
Below are some tips and tricks for getting the best data for your experiment, and how to generate high-quality visualizations.
1. Use track smoothing to remove extraneous tracking points.
One common concern using video analysis for any water-based task is that water easily reflects light. Ideal lighting conditions can prevent direct overhead fluorescent light above the maze, but that is not always easy to achieve. To avoid tracking the reflected light of the water instead of the animal, you can use the Track Smoothing function in EthoVision to remove any outlier data points.
Go to Track Smoothing Profiles under the acquisition tab, and select the Maximum Distance Moved box. By checking this, EthoVision will remove any point that is X cm away from the previous frame and you can manually define what number to set X.
For example, if you set X to 20 cm, EthoVision will automatically remove any tracking point that is 20 cm away from the corresponding point in the previous frame by running the smoothing profile. With a typical frame rate of 30 fps, a 20 cm difference in location within 30 ms is very unlikely and, thus, probably light reflection or another artifact (i.e. fecal matter).
2. Interpolate Missing Samples
Once the sample is removed, you can then go into the Track Editor, and interpolate the missing sample. An interpolated sample uses the coordinates for the frame directly before and after the missing sample to linearly estimate what the missing points should be.
To interpolate a sample, go to Track Editor, click on the frame(s) before a missed sample and drag until that cell, the missing sample cells, and the frame(s) after the missing cell(s) are highlighted in pink. Then click this symbol to interpolate. You can also interpolate by pressing CTRL+I.
3. Use Heatmaps to easily visualize time spent close to the platform.
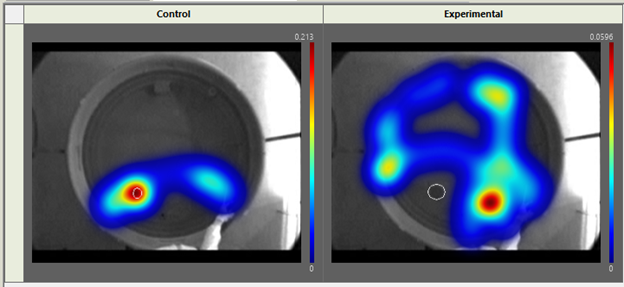
Heatmaps were introduced in EthoVision 10, and allow you to get a visual representation of the time the rodent spends in the maze. You can even merge heat maps within experimental and control groups, so you can easily visualize the change in time spent between different groups.
To merge heat maps to create 1 heatmap per group, you need to assign each trial to a group (control and experimental, for example) in the Trial List. Once this is done, go to Data Profiles and create two result bins, one for control trials and one for experimental.

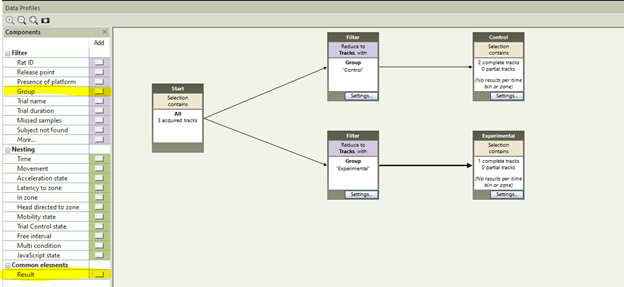
Once your data profile is complete, go to Heatmap Visualization and click Group Mean on the right. This will merge your group data to create a Heatmap for your two distinct groups. You can then overlap important maze features by going to Show/Hide in the top right, and selecting Arena Features. The resulting image is a great way to emphasize group changes for your papers, presentations and posters.
To get started using EthoVision XT, or for more tips and tricks, contact your regional account manager!
References
[1] Morris, R.G.M. (1981). Spatial localization does not depend on the presence of local cues. Learning and Motivation. 12, 239-260.
[2] Morris, R. (1984). Developments of a water-maze procedure for studying spatial learning in the rat. Journal of Neuroscience Methods, 11, 47-60
Related Posts
EthoVision XT and the open field test
